Bayesian Networks
Causality and Metaphysics
The fundamental issue of causal inference is that causal effects cannot be measured directly.
Causal Diagram:
- graphical representation of data generating process (DGP):
- node: variables in the DGP
- arrows: show direction of causation
- large number of test subjects can “skew” proportions
Components
Recall Bayes Theorem: \(P(A|B) = \frac{P(B|A)P(A)}{P(B)}\)
Recall The Law of Total Probability: \(P(A) = \sum\limits_{a \in A}P(B|A=a) P(A=a)\)
- \(P(A|B)\): posterior probability
- \(P(A)\): prior probability
- \(P(B)\): evidence
In general, it is not effective to use The Law of Total Probability in this scenario.
Probability Model: a joint distribution over a set of random variables.
Marginal Distributions are sub-tables which eliminate variables. Marginalization (summing out) is combing collapsed rows by adding.
Marginalization
Given \(P(t, w)\),
- \(P(t) = \sum\limits_w P(t, w)\)
- \(P(w) = \sum\limits_t P(t, w)\)
Recall Independence: \(P(x, y) = P(x) P(y)\)
Implications of Independence in Bayes Theorem
\(P(x|y) = \frac{P(y|x)P(x)}{P(y)}\)
\(= \frac{P(x,y)}{P(y)}\)
\(= \frac{P(x)P(y)}{P(y)}\)
\(= P(x)\)
In other words, given independence, \(P(x|y)= P(x)\), thus we can simplify the model. Given independence, we can say that the conditional probability is equivalent to the prior probability. Naive Assumption which propagates through the model.
Assuming conditional independence, we can say things like:
- \(P(x,y|z) = P(x|z)P(y|z)\)
- \(P(x|z,y) = P(x|z)\)
Causal vs. Bayesian Inference
Bayesian Statistical Framework:
- process of interest
- data collection (evidence)
- build model
- update model
Example
Causal Diagram: \(Rain \rightarrow Traffic\)
Bayesian Network: \(Rain \rightarrow Traffic\)
- with a Bayes Net, the arrow does not necessarily indicate causality
- instead, it is indicating the child node has a conditionally dependent relationship with the parent node and is conditionally independent of non-parent nodes (naive assumption).
The Bayesian Network
The point of a Bayes Net is to represent full joint probability distributions, and to encode an interrelated set of conditional independence/probability statements.
- nodes (events)
- conditional probability tables (CPTs), relating those events
- describe how variables interact locally
- chain together local interactions to estimate global, indirect interactions
To put another way, Bayes Nets implicitly encode joint distributions as a product of the local conditional probabilities.
\(P(x_1, x_2, \dots, x_n) = \prod\limits_{i=1}^n P(x_i | x_{i-1}, x_{i-2}, \dots, x_1\)
Keeping in mind that each node is conditionally independent of its other predecessors, given its parents, we can order in such a way that:
\(\prod\limits_{i=1}^n P(x_i | x_{i-1}, x_{i-2}, \dots, x_1) = \prod\limits_{i=1}^n P(x_i | parents(X_i))\)
Using Causal Diagrams to Construct Bayes Nets
Although a Bayes Net is not necessarily a Causal Diagram, we should create the network in such a way that it flows from cause to effect
- Nodes: What is the set of variables we need to model?
- order them: \(\{X_1, \dots, X_n \}\)
- best if ordered such that causes precede effects
- Links: For each node \(X_i\), do:
- choose a minimal set of parents \(parents(X_i) \subset \{X_{i-1}, \dots, X_1\}\), such that \(P(x_i | x_{i-1}, \dots x_1) = P(x_i | parents(X_i))\)
- for each parent, insert arcs (links) from parent to \(X_i\)
- write down conditional probability table (CPT) \(P(X_i | parents(X_i))\)
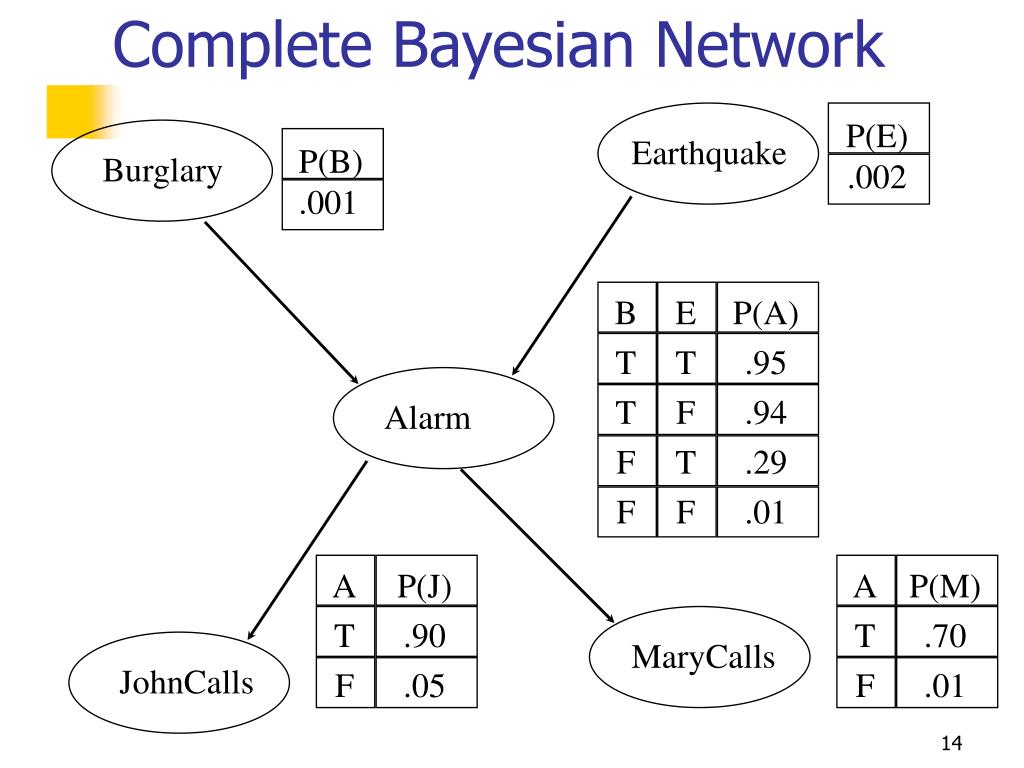
Bayesian Network Example

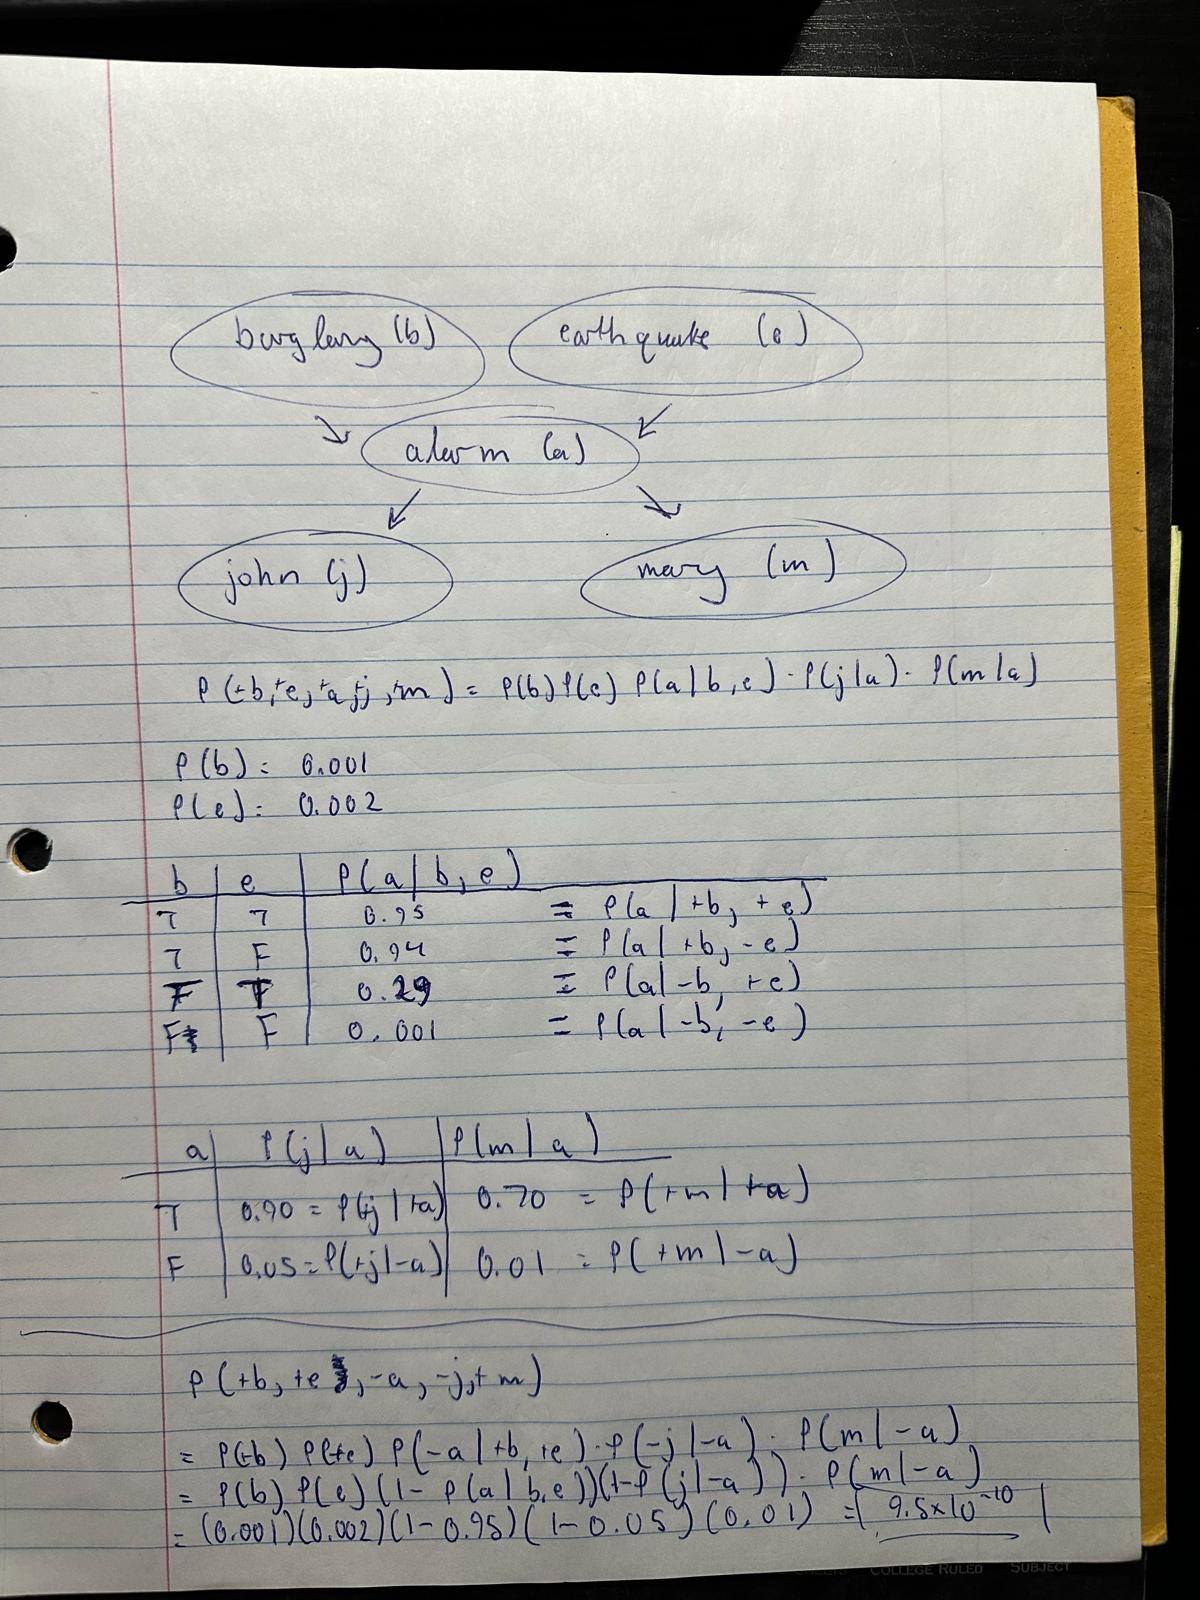
We can use this network to answer questions such as:
\(P(-j, +m, -a, +b, +e)\)
Which if we were to write this out in it’s entirety using formulas/algebra, it would be a cumbersome process. However, using a Bayesian Network to answer this question, we can follow the flow of the diagram to simplify things.

Causal vs. Diagnostic Modeling
Diagnostic: observing an effect leads to competition between possible causes.
- \(X\): Rock in Shoe
- \(Y\): Deformed Foot
- \(Z\): Foot Hurts
We need to diagnose which is most likely:
- \(X \rightarrow Z\)
- \(Y \rightarrow Z\)