Cluster Analysis

Considerations for Cluster Analysis

  • Partitioning Criteria:
    • single level
    • hierarchical partitioning
    • often, multi-level hierarchical partitioning is desirable, i.e. grouping topical terms
  • Separation of Clusters:
    • Exclusive: one customer belongs to only one region
    • Non-Exclusive: one document may belong to more than one clas
  • Similarity Measure:
    • Distance-Based: Euclidean, road network, vector
    • Connectivity-Based: density or contiguity
  • Clustering Space:
    • Full Space: often when low dimensional
    • Subspaces: often in high dimensional clustering

Requirements & Challenges

  • Quality:
    • ability to deal with different types of attributes
      • numerical
      • categorical
      • text
      • multimedia
      • networks
      • mixture of multiple types
  • Scalability:
    • clustering all the data instead of only on samples
    • high dimensionality
    • incremental or stream clustering and insensitivity to input order
  • Constraint-Based Clustering:
    • user-given preferences or constraints
    • domain knowledge
    • user queries
  • Interpretability and Usability

Major Clustering Methods

  • Partitioning Methods:
    • construct k partitions
    • iterative relocation
  • Hierarchical Methods:
    • hierarchical decomposition
    • split/merge
  • Density-Based Methods:
    • connectivity
    • density functions
  • Grid-Based Methods:
    • quantize into cells
    • multi-granuality grid
  • Model-Based Methods:
    • hypothesized cluster model
    • best fit
  • Clustering High-Dimensional Data
    • subspace clustering
    • frequent-pattern-based clustering
  • Constraint-Based Clustering
    • user-specified
    • application-oriented constraints

Partitioning Methods

  • Given a data set D of n objects
  • Given k, find a partition of k clusters that optimizes the chosen partition criterion
  • Global optimal: enumerate all partitions
  • Heuristic methods:
    • K-Means: cluster represented by mean (centroid)
    • K-Medoids: cluster represented by medoid (object closest to centroid)
  • Partitioning method: discovering the groupings in the data by optimizing a specific objective function and iteratively improving the quality of partitions
  • K-partitioning method: partitioning a dataset D of n objects into a set of K clusters so that an objective function is optimized (i.e. sum of squared distances is minimized, where \(c_K\) is the centroid of cluster \(C_k\))
    • a typical objective function: sum of squared errors (SSE): \(SSE(C) = \sum\limits_{k=1}^K \sum\limits_{x_i \in C_k} |x_i - c_k|^2\)
  • Problem definition: given K, find a partition of K clusters that optimizes the chosen partitioning criterion
    • global optimal: needs to exhaustively enumerate all partitions
    • heuristic methods (i.e. greedy algorithms):
      • K-Means
      • K-Medoids
      • K-Medians
      • etc.

K-Means Clustering

Algorithm

  • Partition objects into k nonempty clusters
  • Compute the mean (centroid) of each cluster
  • Assign each object to the closest centroid
    • closest depends on the distance measurement used (i.e. Euclidean, Manhattan, etc.)
  • Repeat until there are no more assignment changes

Discussion

  • Efficiency: \(O(tKn)\)
    • n: number of objects
    • K: number of clusters
    • t: number of iterations
    • normally, \(K, t << n\)
  • K-means clustering often terminates at a local optimum (initialization can be important to find high-quality clusters)
  • Need to specify K, the number of clusters, in advance
    • there are method to automatically determine the “best” K
    • in practice, we often run a range of values and select the “best” K value
  • Sensitive to Noisy Data and Outliers
    • K-medians, K-medoids, etc. can be better equipped to handle outliers
  • K-means applies only to objects in a continuous n-dimensional space
    • using the K-modes for categorical data
  • Not suitable to discover clusters with non-convex shapes
    • more suitable methods are using density-based clustering, kernel K-means, etc.
  • Further Variations of K-Means
    • Choosing better initial centroid estimates
      • K-means++, Intelligent K-Means, Genetic K-Means
    • Choosing different representative prototypes for clusters
      • K-Medoids, K-Medians, K-Modes
    • Applying feature transformation techniques
      • Weighted K-Means, Kernel K-Means

K-Medoids Clustering

  • PAM (partitioning around medoids)
    • starts from an initial set of medoids
    • iteratively replace a medoid with a non-medoid if it reduces the total distance
    • effective for small data sets, does not scale, \(O(k(n-k)^2)\) for each iteration
  • CLARA: apply PAM only multiple sampled sets
  • CLARANS: use randomized samples to search for neighboring solutions

Discussion

  • K-Medoids Clustering: find representative objects (medoids) in clusters
  • PAM
    • starts from an initital set of medoids
    • iteratively replaces one of the medoids by one of the non-medoids if it improves the total sum of squared errors (SSE) of the resulting clustering
    • PAM works effectively for small data sets but does not scale well for large data sets (due to the computational complexity)
  • Efficiency Improvements on PAM:
    • CLARA: PAM on samples
    • CLARANS: randomized re-sampling, ensuring efficiency & quality

Elbow Method

  • heuristic used to determine the optimal number of clusters (k) for a clustering algorithm, such as K-Means
  • involves plotting the within-cluster sum of squares WCSS for a range of k values and looking for an “elbow” point on the graph
  • mathematical elbow: the point where the rate of decrease in WCSS sharply changes is a good choice for the number of clusters
Code
wcss = [] # within-cluster sum of squares
for i in range(1, 11):
  model = KMeans(n_clusters = i)
  y_kmeans = model.fit_predict(x)
  wcss.append(model.intertia_) # adding accuracy to our model
Hierarchical Clustering

  • Basics
    • generate a clustering hierarhcy (drawn as a dendrogram)
    • not required to specify K, the number of clusters
    • more deterministic
    • no iterative refinement
  • Two Categories of Algorithms
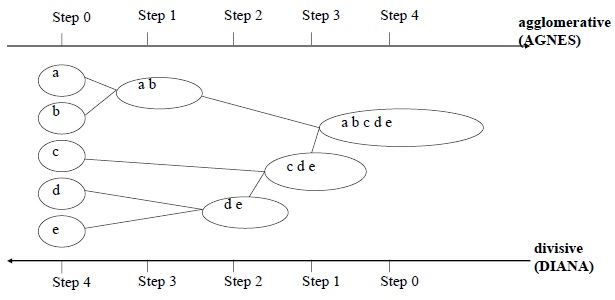
    • agglomerative: start with singleton clusters, continuously merge two clusters at a time to build a bottom-up hierarchy of clusters
    • divisive: start with a huge macro-cluster, split it continuously into two groups, generating a top-down hierarchy of clusters

Dendrogram: How Clusters are Merged

  • Dendrogram: decompose a set of data objects into a tree of clusters by multi-level nested partitioning
  • A clustering of the data objects is obtained by cutting the dendrogram at the desired level, then each connected components forms a cluster

Agglomerative Clustering Algorithm

  • AGNES (AGglomerative NESting)
    • use single-link method and the dissimilarity matrix
    • continuously merge nodes that have the least dissimilarity
    • eventually all nodes belong to the same cluster
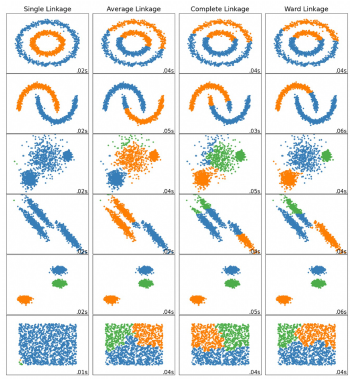
  • Agglomerative clustering varies on different similarity measures among clusters
    • single link (nearest neighbor)
    • complete link (diameter)
    • average link (group average)
    • centroid link (centroid similarity)

Agglomerative

  • each observation starts in its own cluster
  • clusteres are successively merged together
  • linkage criteria determines merge strategy
    • ward: minimize the sum of squared differences within clusters
    • max/complete: minimize the max distance within clusters
    • average: minimize the average distance within clusters
    • single: minimize the minimal distance within clusters

Feature Agglomerative

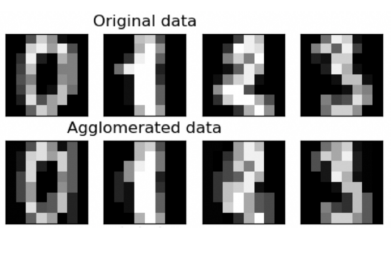
  • Feature Agglomerative uses agglomerative clustering to group together features that look very similar, thus decreasing the number of features
  • dimensionality reduction tool

Implementation (sklearn)

Import Libraries and Make Data

Code
# libraries
from sklearn.datasets import make_blobs
from sklearn.cluster import KMeans
import pandas as pd
import matplotlib.pyplot as plt
import seaborn as sns

# data
x, y = make_blobs(n_samples=100,
                  centers=4, n_features=2,
                  cluster_std=[1,1.5,2, 2],
                  random_state=7)
                  
# make blobs
df_blobs = pd.DataFrame({
    'x1': x[:,0],
    'x2':x[:,1],
    'y':y

})

df_blobs.head()
x1 x2 y
0 -3.384261 5.221740 1
1 -1.836238 -7.735384 3
2 -7.456176 6.198874 0
3 -1.785043 1.609749 1
4 -10.124910 6.133805 0

2-D Plot Function

Code
def plot_2d_clusters(x, y, ax):
    y_uniques = pd.Series(y).unique()

    for cl in y_uniques:
        x[y==cl].plot(
            title=f'{len(y_uniques)} Clusters',
            kind='scatter',
            x='x1',
            y='x2',
            marker = f'${cl}$',
            ax = ax
        )

First Image

Code
fig, ax = plt.subplots(1,1, figsize=(15,10))
x, y = df_blobs[['x1','x2']], df_blobs['y']
plot_2d_clusters(x,y,ax)

Applying Clustering

Code
kmeans = KMeans(n_clusters=100, random_state=7)
y_pred = kmeans.fit_predict(x)
C:\Users\carlj\anaconda3\lib\site-packages\sklearn\cluster\_kmeans.py:1412: FutureWarning:

The default value of `n_init` will change from 10 to 'auto' in 1.4. Set the value of `n_init` explicitly to suppress the warning

C:\Users\carlj\anaconda3\lib\site-packages\sklearn\cluster\_kmeans.py:1436: UserWarning:

KMeans is known to have a memory leak on Windows with MKL, when there are less chunks than available threads. You can avoid it by setting the environment variable OMP_NUM_THREADS=1.
Code
fig, axs = plt.subplots(1, 2, figsize=(20,12))
plot_2d_clusters(x,y,axs[0])
plot_2d_clusters(x,y_pred,axs[1])

axs[0].set_title(f'Actual {axs[0].get_title()}')
axs[1].set_title(f'Kmeans {axs[1].get_title()}')
Text(0.5, 1.0, 'Kmeans 100 Clusters')

Test on Real Data

Code
df = pd.read_csv('data/uber_clean.csv')
df.head()
Date/Time Lat Lon Base Date
0 2014-07-01 0:03 40.7586 -73.9706 B02512 Tuesday
1 2014-07-01 0:05 40.7605 -73.9994 B02512 Tuesday
2 2014-07-01 0:06 40.7320 -73.9999 B02512 Tuesday
3 2014-07-01 0:09 40.7635 -73.9793 B02512 Tuesday
4 2014-07-01 0:20 40.7204 -74.0047 B02512 Tuesday
Code
x = df[["Lat", "Lon"]] # features
x.head()
Lat Lon
0 40.7586 -73.9706
1 40.7605 -73.9994
2 40.7320 -73.9999
3 40.7635 -73.9793
4 40.7204 -74.0047
Code
model = KMeans(n_clusters = 3)
y_kmeans = model.fit_predict(x)
df['y'] = y_kmeans  # store it in an actual frame
df.head()
plt.scatter(df['Lon'], df['Lat'], c=df['y']) # colorized based on y-values (clusters based on lat long k-means)
C:\Users\carlj\anaconda3\lib\site-packages\sklearn\cluster\_kmeans.py:1412: FutureWarning:

The default value of `n_init` will change from 10 to 'auto' in 1.4. Set the value of `n_init` explicitly to suppress the warning

Inertia

Code
# model inertia: measures how well a data set was clustered by k-means

# meaure the distance between each data point and its centroid, square this distance, and sume up
# these squares across one cluster

# a good model is one with a low inertia value and low number of cluster (K)

model.inertia_
1957.7363841201532

Elbow Method

Code
wcss = [] #  within-cluster sum of squares
for i in range(1,11):
    model = KMeans(n_clusters = i)
    y_kmeans = model.fit_predict(x)
    wcss.append(model.inertia_)  # adding accuracy to our model
    
plt.plot(range(1,11), wcss)
plt.xlabel('Number of Clusters')
plt.ylabel('WCSS')
plt.title('Elbow Method')
plt.show()
C:\Users\carlj\anaconda3\lib\site-packages\sklearn\cluster\_kmeans.py:1412: FutureWarning:

The default value of `n_init` will change from 10 to 'auto' in 1.4. Set the value of `n_init` explicitly to suppress the warning

C:\Users\carlj\anaconda3\lib\site-packages\sklearn\cluster\_kmeans.py:1412: FutureWarning:

The default value of `n_init` will change from 10 to 'auto' in 1.4. Set the value of `n_init` explicitly to suppress the warning

C:\Users\carlj\anaconda3\lib\site-packages\sklearn\cluster\_kmeans.py:1412: FutureWarning:

The default value of `n_init` will change from 10 to 'auto' in 1.4. Set the value of `n_init` explicitly to suppress the warning

C:\Users\carlj\anaconda3\lib\site-packages\sklearn\cluster\_kmeans.py:1412: FutureWarning:

The default value of `n_init` will change from 10 to 'auto' in 1.4. Set the value of `n_init` explicitly to suppress the warning

C:\Users\carlj\anaconda3\lib\site-packages\sklearn\cluster\_kmeans.py:1412: FutureWarning:

The default value of `n_init` will change from 10 to 'auto' in 1.4. Set the value of `n_init` explicitly to suppress the warning

C:\Users\carlj\anaconda3\lib\site-packages\sklearn\cluster\_kmeans.py:1412: FutureWarning:

The default value of `n_init` will change from 10 to 'auto' in 1.4. Set the value of `n_init` explicitly to suppress the warning

C:\Users\carlj\anaconda3\lib\site-packages\sklearn\cluster\_kmeans.py:1412: FutureWarning:

The default value of `n_init` will change from 10 to 'auto' in 1.4. Set the value of `n_init` explicitly to suppress the warning

C:\Users\carlj\anaconda3\lib\site-packages\sklearn\cluster\_kmeans.py:1412: FutureWarning:

The default value of `n_init` will change from 10 to 'auto' in 1.4. Set the value of `n_init` explicitly to suppress the warning

C:\Users\carlj\anaconda3\lib\site-packages\sklearn\cluster\_kmeans.py:1412: FutureWarning:

The default value of `n_init` will change from 10 to 'auto' in 1.4. Set the value of `n_init` explicitly to suppress the warning

C:\Users\carlj\anaconda3\lib\site-packages\sklearn\cluster\_kmeans.py:1412: FutureWarning:

The default value of `n_init` will change from 10 to 'auto' in 1.4. Set the value of `n_init` explicitly to suppress the warning

Visualize Data on a Map

Code
# import folium
import folium
Code
# visaulize data in actual map

df = df[:2000]  # instead of 40,000

clusters1  = df[['Lat', "Lon"]][df['y'] == 0].values.tolist()
clusters2  = df[['Lat', "Lon"]][df['y'] == 1].values.tolist()
clusters3  = df[['Lat', "Lon"]][df['y'] == 2].values.tolist()

# map
city_map = folium.Map(location= [40.7128, -74.0060], zoom_start = 10, titles = "openstreetmap")

for i in clusters1:
    folium.CircleMarker(i, radius =2, color = 'blue', fill_color = 'lightblue').add_to(city_map)

for i in clusters2:
    folium.CircleMarker(i, radius =2, color = 'red', fill_color = 'lightred').add_to(city_map)

for i in clusters3:
    folium.CircleMarker(i, radius =2, color = 'green', fill_color = 'lightgreen').add_to(city_map)
    
city_map
Make this Notebook Trusted to load map: File -> Trust Notebook