COVID-19 Analysis
r
r-studio
tidyverse
exploratory
analysis
lubridate
usmap
gridextra
zoo
Analyzed COVID-19 from several sources using R.
The goal of this project was to manipulate COVID-19 and population data across multiple sources to solve desired inquiries. Local data from the United States as well as global data is analyzed.
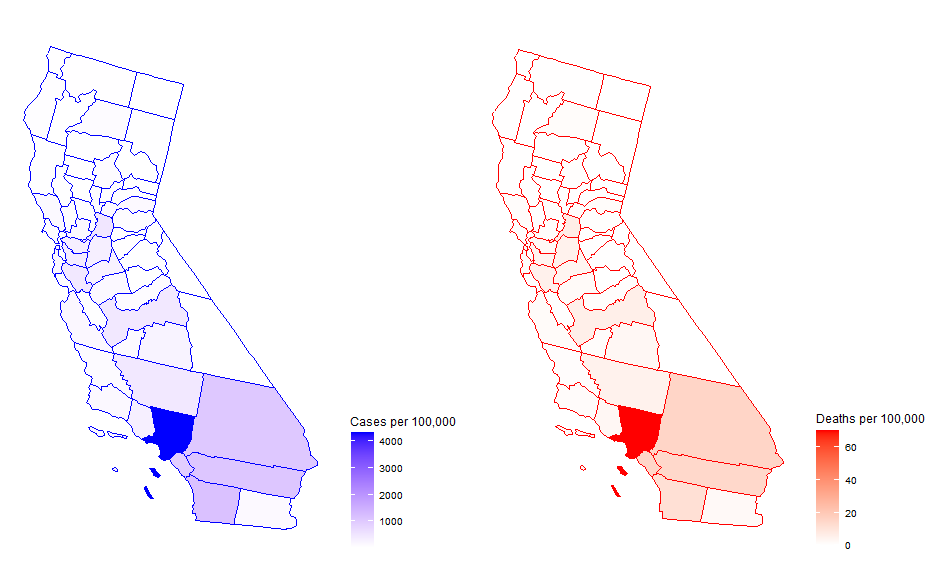
Among the findings, there was one such visual I found compelling. The visual is of California broken down into counties showing a correlation of areas with higher concentrations of cases having higher concentrations of death.
